 All-in-One COB LED TV
  Flexible LED Displays
  Transparent LED Displays
  Led Poster
  Circular LED Displays
  Creative & Custom LED Displays
  Quick Answer — Decision Framework
- → Min. distance (m) = pixel pitch (mm)
- → Comfortable range = pitch × 2 to × 3
- → This is the single most important variable
- → COB/MIP above 400 lux ambient light
- → SMD fine for controlled indoor spaces
- → COB contrast: 8,000:1 vs SMD 3,000:1
- → P1.2 has 56% more LEDs/m² than P1.5
- → Upgrading P1.5 → P1.2 = +30–50% cabinet cost
- → If two pitches qualify, choose the coarser one
Wait — Ask These Questions First
When a client asks “should we go with P1.2 or P1.5?”, most integrators answer the question directly. That’s the wrong move.
Pixel pitch is an output, not an input. The correct starting point is always the same three questions: How far will the audience sit from the screen? What content will be displayed? What is the available budget relative to screen area? Answer those three, and the pixel pitch selects itself.
The P1.2-vs-P1.5 debate is real — but it only matters after you’ve established the viewing geometry. A P1.5 screen viewed from 4 meters delivers more perceived resolution than a P1.2 screen viewed from 2 meters, because at 2 meters the viewer is inside the minimum comfortable viewing distance for either pitch. The same logic applies at the other end: a P2.0 or P2.5 LED display specified correctly for a 10m+ viewing distance will outperform a P1.5 display that was over-specified for the same space and under-budgeted as a result.
Getting this sequence wrong is how projects end up over-specified and over-budget, or under-specified with visible pixel structure the client blames on the integrator.
This guide works through the decision in the correct order: distance first, resolution second, environment third, budget last.
Two Formulas. Use Both.

The first is the minimum distance rule — fast, reliable for client conversations:
Minimum viewing distance (m) = Pixel Pitch (mm) × 1
P1.5 means 1.5m minimum. P2.5 means 2.5m minimum. At this distance, individual pixels are technically visible under close inspection, but the image reads as acceptable for most content types.
The second is the comfortable viewing range — what you actually design around:
Comfortable viewing distance (m) = Pixel Pitch (mm) × 2 to × 3
Use ×2 for static, detail-heavy content — data dashboards, text-heavy presentations, control room monitoring. Use ×3 for video, motion graphics, and general AV where minor pixel structure is less perceptible.
These two formulas together give you a minimum threshold and a target range — which is what project planning requires.
Ambient light is measured in lux. Display brightness is measured in nits (cd/m²).
| Pixel Pitch | Min. Distance (×1) | Recommended Range (×2–×3) | Typical Application |
|---|---|---|---|
| P0.9 | 0.9m | 1.8m – 2.7m | VP/XR studios, broadcast |
| P1.2 | 1.2m | 2.4m – 3.6m | Control rooms, boardrooms |
| P1.5 | 1.5m | 3.0m – 4.5m | Conference rooms, lobbies |
| P1.8 | 1.8m | 3.6m – 5.4m | Training rooms, showrooms |
| P2.0 | 2.0m | 4.0m – 6.0m | Auditoriums, large lobbies |
| P2.5 | 2.5m | 5.0m – 7.5m | Large auditoriums, atriums |
These numbers assume controlled indoor lighting. In high-ambient-light environments — daylit lobbies, retail floors — perceived sharpness drops and the minimum distance effectively shifts closer. That interaction is covered in Section 04.
Pixel Pitch vs. Screen Size vs. Resolution

Pixel pitch determines how many pixels fit into a given screen area. For any fixed screen size, changing the pixel pitch changes the native resolution — and that has direct implications for signal source, content production, and client expectations.
The formula:
Horizontal pixels = Screen width (mm) / Pixel pitch (mm)
Vertical pixels = Screen height (mm) / Pixel pitch (mm)
For a 6m × 3.375m screen (standard 16:9)
| Pixel Pitch | Horizontal × Vertical | Native Resolution | Equivalent To |
|---|---|---|---|
| P0.9 | 6667 × 3750 | ~25MP | Well above 4K |
| P1.2 | 5000 × 2813 | ~14MP | Above 4K |
| P1.5 | 4000 × 2250 | ~9MP | 4K class |
| P1.8 | 3333 × 1875 | ~6MP | Between 2K and 4K |
| P2.0 | 3000 × 1688 | ~5MP | Slightly above 2K |
| P2.5 | 2400 × 1350 | ~3.2MP | Below 2K |
For a smaller boardroom — 4m × 2.25m (16:9)
| Pixel Pitch | Horizontal × Vertical | Native Resolution | Equivalent To |
|---|---|---|---|
| P1.2 | 3333 × 1875 | ~6MP | Between 2K and 4K |
| P1.5 | 2667 × 1500 | ~4MP | Close to 4K |
| P1.8 | 2222 × 1250 | ~2.8MP | Above 2K |
| P2.0 | 2000 × 1125 | ~2.25MP | Slightly above 2K |
The critical question: what signal source is the client actually feeding the wall?
In most corporate AV installations, the answer is a laptop, media player, or video conferencing system — all outputting 1080p or 4K at best. A P1.2 wall at 6×3.375m has a native resolution of roughly 5000×2813, which exceeds 4K. Upscaling a 4K source to fill that canvas works — but it means the extra pixel density you paid for isn’t being fully utilized.
This isn’t an argument against P1.2. It’s an argument for understanding what you’re actually buying. In our LA projects — COB Pro P1.2 walls ranging from 4×3m to 6×2m — the pixel density decision was driven by viewing distance, content precision requirements, and the need for near-2K native resolution for high-definition commercial advertising. At those distances, P1.2 delivers visibly sharper text rendering and finer image detail than P1.5, regardless of what the resolution arithmetic says.
Screen size sets the canvas. Pixel pitch sets the pixel count. Signal source determines how much of that pixel count gets used. Align all three before specifying.
Ambient Light, Brightness, and When Pixel Pitch Interacts with Environment

Pixel pitch gets most of the attention in spec discussions. Ambient light rarely does. That’s backwards for a significant portion of real-world installations.
Here’s the practical reality: a P1.5 COB display in a well-controlled room at 200 lux ambient will deliver sharper perceived image quality than a P1.2 SMD display in a daylit lobby at 800 lux. The pixel pitch difference is real — the environment difference is larger.
Why encapsulation technology matters here
COB and MIP encapsulation cover the entire module surface with a continuous resin or epoxy layer, eliminating the exposed gaps between pixels that characterize SMD construction. Those gaps reflect ambient light directly back at the viewer, reducing contrast and washing out the image. In high-ambient-light conditions, SMD displays require significantly higher brightness output to compensate — which accelerates LED degradation and increases power consumption.
For COB displays, the black resin surface absorbs ambient light rather than reflecting it. This is why COB panels typically specify contrast ratios of 8,000:1 to 12,000:1 under ambient light, compared to 3,000:1 to 5,000:1 for equivalent SMD panels in the same environment. That difference is perceptible at normal viewing distances.
Brightness requirements by environment
Ambient light in lux. Display brightness in nits (cd/m²).
| Environment | Ambient Light (lux) | Recommended Brightness | Compatible Pitch Range |
|---|---|---|---|
| Broadcast / VP studio | 800–1200 | 800–1200 nits | P0.9 – P1.5 COB/MIP |
| Control room | 300–500 | 400–600 nits | P1.2 – P1.5 |
| Conference room (controlled) | 200–400 | 300–500 nits | P1.2 – P2.0 |
| Corporate lobby (daylit) | 500–1000 | 600–1000 nits | P1.5 – P2.5 |
| Retail floor (mixed) | 600–1200 | 800–1500 nits | P1.8 – P2.5 |
| Training room | 300–500 | 300–500 nits | P1.5 – P2.5 |
LED displays typically run at 30–50% of maximum brightness in daily operation to extend panel lifespan. Confirm that the display’s rated brightness at 50% output still meets the environment requirement — not just the peak spec.
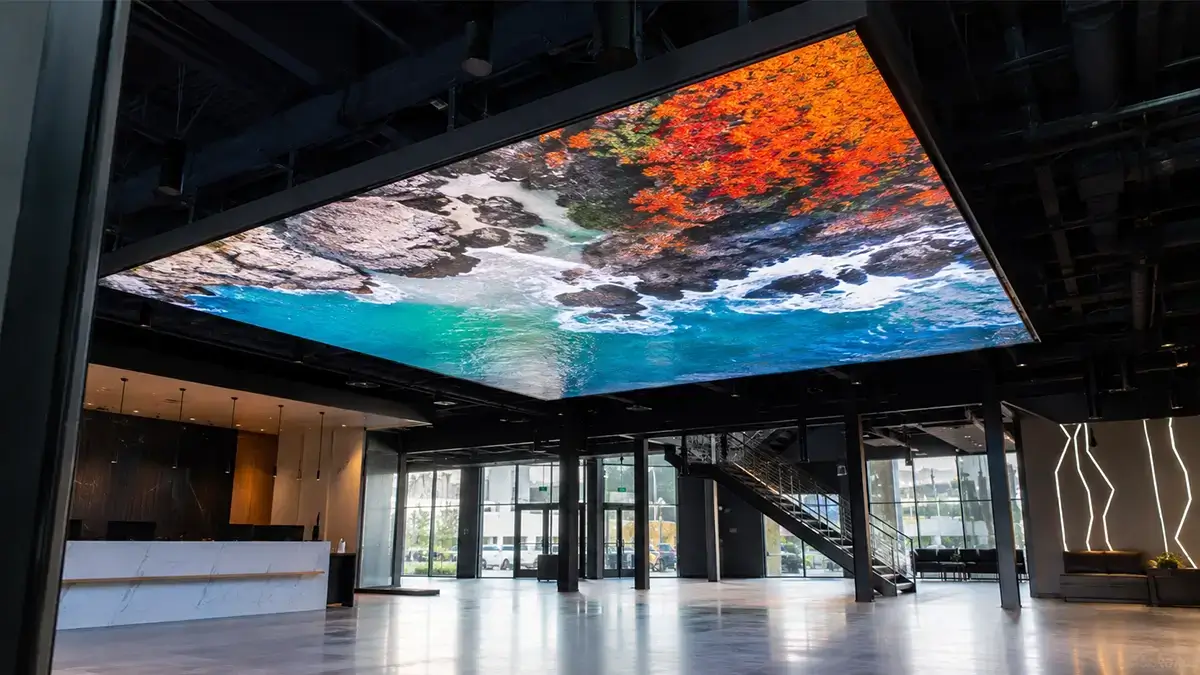
In our Canadian project — 65m² Brick series P1.5, ceiling-mounted — the client required 4K immersive content with viewers looking upward at close visual range. The ceiling height placed the display within the comfortable viewing range for P1.5 (3.0m–4.5m). At 65m², P1.5 delivers native resolution well above 4K class, making P1.2 unnecessary from both a resolution and cost standpoint.
For ceiling installations generally: P1.5 is the practical fine-pitch limit for most spaces. The exception is low-ceiling immersive environments where the viewer is intentionally close to the surface.
The Real Cost Difference Between P1.2, P1.5, P2.0 and P2.5
Pixel pitch affects cost two ways: upfront cabinet price and long-term maintenance cost. Both scale with pixel density. Neither relationship is linear.
Why finer pitch costs more
Smaller pixel pitch means more LEDs per square meter. A P1.2 panel contains approximately 69,444 pixels/m², compared to 44,444 for P1.5 and 25,000 for P2.0. That’s a 56% increase in LED count from P1.5 to P1.2, and a 178% increase from P2.0 to P1.2. More LEDs means higher component cost, tighter manufacturing tolerance, lower yield rates, and more complex driver circuitry — all of which flow through to the cabinet price.
Relative cost index (P2.0 = 1.0)
| Pixel Pitch | Pixel Density (pixels/m²) | Relative Cabinet Cost | Relative Maintenance Cost |
|---|---|---|---|
| P0.9 | 123,457 | 3.5× – 4.5× | High |
| P1.2 | 69,444 | 2.0× – 2.5× | Medium-High |
| P1.5 | 44,444 | 1.4× – 1.7× | Medium |
| P1.8 | 30,864 | 1.2× – 1.4× | Medium-Low |
| P2.0 | 25,000 | 1.0× (baseline) | Low |
| P2.5 | 16,000 | 0.75× – 0.85× | Low |
Relative indices for budget planning. Actual pricing varies by encapsulation type, cabinet construction, and order volume.
The upgrade cost question
A common client ask: “How much more does it cost to go from P1.5 to P1.2?” For a typical 20m² installation, upgrading from P1.5 to P1.2 represents approximately 30–50% more in cabinet cost alone, before any changes to structural support or controller requirements. For a 65m² installation — our Canadian ceiling project — that delta becomes a significant budget line. In that project, P1.5 was selected not as a compromise but as the engineered decision: native resolution at that scale already exceeded 4K, and viewing geometry confirmed the pitch selection.
Maintenance cost scales with pixel count
Every LED is a potential failure point. A P1.2 panel has 56% more failure points per m² than a P1.5 panel. For fixed installations with front-access maintenance, this is manageable. For ceiling-mounted or rear-access-only installations, each maintenance event carries higher labor cost — which means the long-term TCO difference between P1.2 and P1.5 is wider than the cabinet price delta suggests.
P2.0 and P2.5 in budget-sensitive markets
P2.0 and P2.5 LED displays occupy a distinct position that fine-pitch discussions often overlook. In markets across Southeast Asia, the Middle East, Africa, and Latin America — where labor costs are lower and project budgets are more constrained — P2.0 and P2.5 SMD modules combined with frameless, weld-free mounting structures represent the dominant installation method for fixed indoor displays. This is not a compromise approach. It is a correctly engineered solution for environments where viewing distances exceed 6m, content requirements are text and standard video, and long-term serviceability is handled by local labor.
The economics are driven by manufacturing volume. P2.0 and P2.5 SMD modules are produced at scale for China’s own large-volume domestic market — churches, schools, government buildings, community centers. That production volume keeps module prices low and supply chains reliable.
Where viewing distance comfortably supports P1.5, upgrading to P1.2 delivers diminishing visual returns while increasing both upfront spend and long-term maintenance exposure. Upgrade to P1.2 when geometry requires it — not as a default premium option. And where viewing distance, content type, and budget all point to P2.0 or P2.5, specify accordingly without treating it as a downgrade.
Matching Pixel Pitch to Application: 12 Scenarios
How to read this table: start with viewing distance. If the typical audience position falls within the recommended range for a given pitch, that pitch is technically qualified. Cross-check ambient light — if the environment is high-lux, move toward COB or MIP regardless of pitch. Then apply budget sensitivity: if two pitch options are both technically qualified, the coarser pitch is the correct engineering choice unless specific content or client requirements justify the finer option.
| Application | Typical Viewing Distance | Ambient Light | Recommended Pitch | Min. Screen for 2K | Notes |
|---|---|---|---|---|---|
| VP / XR studio | 1.5m – 3m | 800–1200 lux | P0.9 – P1.2 COB | 1.8m × 1.0m | Refresh ≥7680Hz for camera capture |
| Broadcast studio | 2m – 4m | 600–1000 lux | P1.2 – P1.5 COB | 2.4m × 1.35m | Color accuracy critical; COB/MIP only |
| Control room | 2m – 4m | 300–500 lux | P1.2 – P1.5 | 2.4m × 1.35m | 24/7 operation; front access preferred |
| Boardroom / executive | 2.5m – 4m | 200–400 lux | P1.2 – P1.5 | 2.4m × 1.35m | Often replacing LCD video walls |
| Conference room | 3m – 5m | 200–400 lux | P1.5 – P1.8 | 3.0m × 1.69m | P1.5 sufficient for most corporate AV |
| Training room | 3m – 6m | 300–500 lux | P1.5 – P2.0 | 3.0m × 1.69m | Large audience, varied seating distances |
| Retail showroom | 2m – 5m | 600–1200 lux | P1.8 – P2.5 | — | Brightness priority over pixel density |
| Corporate lobby | 4m – 8m | 500–1000 lux | P2.0 – P2.5 | — | High ambient light; COB advantage significant |
| Auditorium | 6m – 15m | 100–300 lux | P2.0 – P2.5 | 4.0m × 2.25m | Viewing distance drives selection |
| House of worship | 8m – 20m | 200–500 lux | P2.0 – P2.5 | — | Text and video; SMD viable; module-on-wall common |
| Ceiling installation | Ceiling height dependent | Controlled | P1.5 – P2.0 | — | Maintenance access is primary constraint |
| Event / touring rental | 4m – 12m | Variable | P2.0 – P3.9 | — | Weight and setup speed priority |
Where some viewers are at 2m and others at 6m in the same room: design for the closest viewer — they will see pixel structure first. A P1.5 wall that works for a front-row viewer at 2.5m will always work for a back-row viewer at 6m. The reverse is not true.
Four Projects, Four Decisions
Each project illustrates a different decision logic — sometimes justifying a premium specification, sometimes confirming why a coarser pitch was the correct call.



A professional video production company. Total area 33m², COB Pro P0.9, direct-corner configuration. They knew exactly what they specified.
- Viewing distance under 1m at closest position
- P0.9 was minimum technically appropriate option
- COB required for corner mechanical stress resistance
- Outcome: immersive content, no visible pixel structure
Commercial advertising displays in public-facing environments, ranging from 4×3m to 6×2m. General public could approach and touch the surface.
- Near-2K native resolution for HD commercial content
- Public touch risk → COB only viable option
- P1.5 would have been visibly softer at close range
- Outcome: Durable, near-2K resolution, multi-aspect ratio
Large-format ceiling installation, immersive 4K experience, viewers looking upward at close visual range.
- 65m² P1.5 exceeds 4K native resolution
- P1.2 would have added cost without visual benefit
- Correct budget point maintained 4K requirement
- Outcome: 4K at correct price — not a compromise
Two screens flanking the stage, 48m² total. Standard SMD, direct module-on-wall installation without cabinets.
- 12m viewing distance (well beyond P2.5 threshold)
- SMD fine for 200–400 lux church environment
- COB would have been unjustified cost at 12m
- Outcome: Clear text and video at 30% below cabinet cost
Send us the room dimensions, viewing distance, and application. We’ll confirm the pitch and provide a quote within one business day.